
In our April issue we reported that both Bangalow and the 2479 postcode grew a lot between 2016 and 2021 – both population and houses. In this article Jenny Bird looks at income – did we grow richer as well as bigger?
One of our granddaughters likes to play ‘guess which car that is’. The other day she said “Nan, there’s a Porsche parked out the front of your house. And the one next to it – with four rings in a row – what’s that called?” ‘That’s an Audi,” I replied. “An Aldi?” she asked, a bit confused. “No darling not an Aldi, an Audi,” I replied, a bit amused.
She’s not the only one to have noticed a change in the ‘signifiers of wealth’ in Bangalow and the hinterland during and since COVID.
The exodus from the cities to regional areas was well underway by the time the last Census was taken in August 2021. For many people opportunities for regional remote working made the move to lifestyle destinations like Bangalow irresistible. The Census tells us that in Bangalow in 2021 a whopping 30.9% of the workforce worked from home – nearly double the figure (15.9%) from 2016. But you had to be able to afford the move. The property market went into overdrive, peaking around June 2022 at a median price of close to $2 million for a house in Bangalow.
Household income
There are various ways that the Census reports on wealth. One is the data it collects on different types of income, both individual and household: wages and salaries; government pensions/benefits/ allowances; superannuation and investment income; and profit/loss from unincorporated businesses and rental properties. Many households have multiple income streams – one person works full time, another works part-time, someone might be running a business, there might be rent or short term rental accommodation (STRA) income from a secondary dwelling, a grandparent might live in with a pension or superannuation income. Between 2016 and 2021 the weekly median household income for the Bangalow village grew by 49.5%. The hinterland showed a similar figure (49.2%). I showed the figures to a Census-nerd colleague who said, without hesitating, “that represents a significant demographic change”. It is a figure worthy of closer investigation. The first question we might ask is: was that level of growth typical elsewhere or was Bangalow/2479 unusual? The figures below show that our income grew more than double the rates for both NSW and Australia. The Byron Shire figures also showed growth greater than for NSW and Australia as a whole, but Bangalow’s household incomes grew even higher.
Median weekly household income
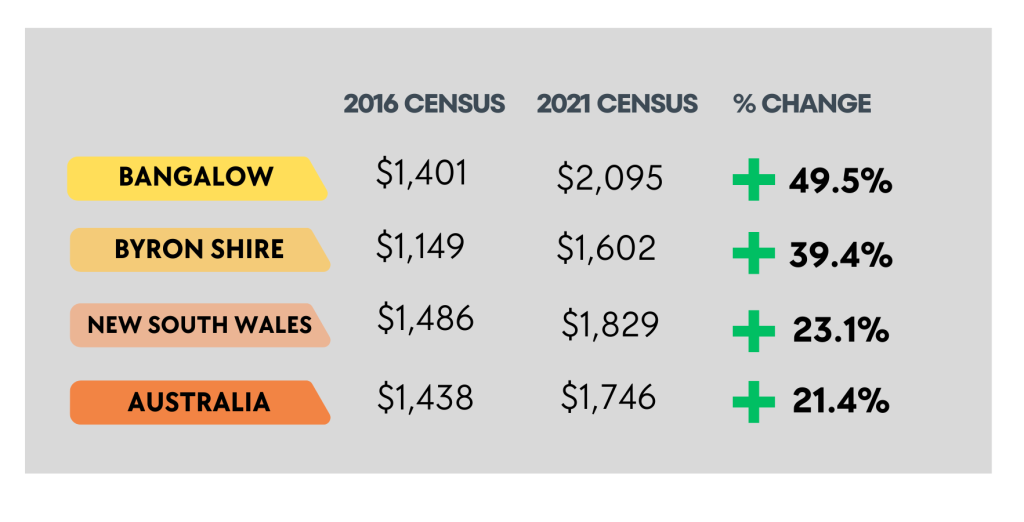
The second question we might ask is: has it always been the case that Bangalow’s median household income is high? No. It’s a fairly recent phenomenon. Back in 2016 Bangalow’s median household weekly income was slightly below state and national medians (but higher than for Byron Shire).
Looking at other Census data all of the following can be eliminated as explanations for the large growth in median household income. It’s not that the employment rate increased. It’s not that more people worked full time compared to part-time. It’s not that more people are living in each household and therefore bringing in more income streams. It’s not that more baby boomers moved here with big superannuation incomes (Bangalow’s median age fell from 42 to 39). It’s not wages growth (which averaged only 3.07% from 1998 to 2023). And ask any Centrelink recipient, there was certainly not a 50% increase in government benefits.
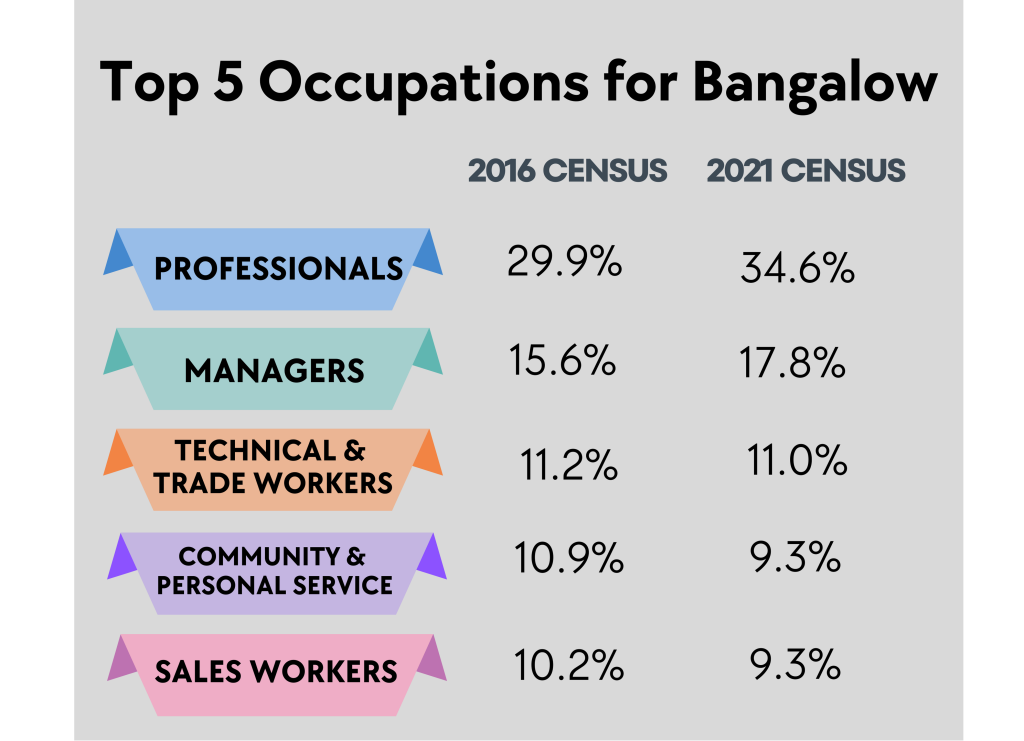
Could it be that people are doing different jobs and/or jobs that pay more? Whilst the top five occupations did not change between 2016 to 2021, there was an increase in the proportion of both ‘professionals’ and to a lesser degree ‘managers’ in Bangalow’s workforce. The proportion of ‘professionals’ is above state and national figures. However, the increases are not sufficient alone to explain a 49.5% growth in median household income.
What we are left with to explain the 49.5% increase in median household income are the remaining income types: investment income/dividends, profit/loss from unincorporated businesses and rental properties. To do so we need to move outside the Census to other reports, and we can only hypothesise about their possible contribution.
It’s possible, for example, that people with investment portfolios have enjoyed increases in investment income. Corporate profits in mining, banks, healthcare companies, retailers and fast food firms saw shareholder wealth soar during the pandemic. Many analysts reported on the ‘fault lines’ that COVID exposed as ‘tragic for the many but good for a privileged few.’
A 2022 ‘economic health check’ report by .id for Byron Shire Council found that COVID had a significant impact on the economy of Byron Shire, with the tourism sector hit particularly hard. The post-COVID recovery has been slower in Byron Shire than in regional NSW. With this in mind it is hard to see how local business profits drove the increase in our income. However, some businesses were advantaged by COVID, and these businesses – owned by locals but located outside the Shire – may have played a part in the increase in Bangalow’s median household income.
It is also possible that rental income played a part in the 49.5% increase. Residents may have more investment properties, here or elsewhere that provide an income stream. Incomes from short term rental accommodation may have increased. In the Bangalow village there are about 113 entire homes/apartments identified on an Inside Airbnb map of Byron Shire. Bangalow and hinterland residents have been very active building and renovating what Council call ‘infill’ – secondary dwellings like studios and granny flats. Many households use secondary dwellings as STRA, adding a passive income stream to other household incomes, sometimes to help pay for large mortgages. Airbnb tells us that the average income from an Airbnb dwelling in Byron Shire is $20,917. Some STRA houses in Bangalow report incomes of $70,000 – $90,000 per annum.
Socio-economic advantage
Each Census the Australian Bureau of Statistics combines data on income, education, employment, occupation, housing and family structure to establish an index (the SEIFA index) of relative socioeconomic advantage and disadvantage. The higher the score the higher the socioeconomic advantage.
In 2021 Bangalow scored 1082, placing it in the top 10% of socioeconomically advantaged suburbs/localities in Australia. The 2479 postcode overall scored 1080 which put it in the second top 10%, where Byron Shire as a whole also sits.
Just to put that in perspective, the Woollahra LGA in Sydney is the most socially advantaged LGA in Australia with a score of 1176. Woorabinda, a small Aboriginal community in Central Queensland, is the most socially disadvantaged LGA in Australia with a score of 659.
We are by any measure an advantaged community. We live at the top of Australia’s socioeconomic ladder.