This, the second in the Herald’s Census 2021 series, analyses data on population and housing collected by the ABS on the 10 August 2021. At the time most Australians were in COVID lockdowns and a lot has happened since then – floods, inflation, interest rate hikes, a national housing crisis, a boom in house prices. What can we learn from the 2021 Census about population growth and housing? And what did and didn’t change in the village of Bangalow and the larger 2479 postcode between 2021 and previous Census?
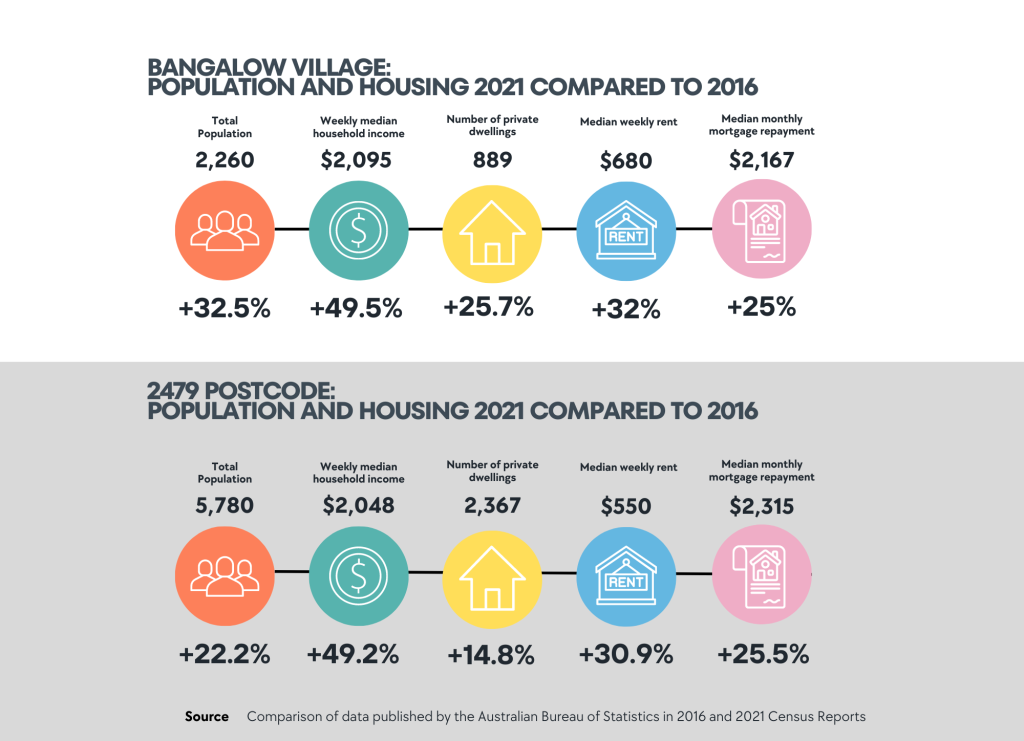
The Census confirms what most residents already know – the population of both the Bangalow village and the 2479 postcode has grown. As of 2021 there were 2,260 people living in the village of Bangalow, and 5,780 in the whole 2479 postcode. The increase in population for the Bangalow village between 2016 and 2021 was 32.5%. This growth spurt was nearly three times the 12.2% increase in the previous Census period 2011-2016. In fact if we look at the 10 year period 2011-2021 the population of the village has grown by 48.7%.
For the whole 2479 postcode, the population growth between 2001 and 2016 was not quite as high – 22.2%, but significantly higher than the 4.2% growth of the previous Census period. When Council complete their analysis of the whole Shire we can compare these growth rates with both the Shire overall and other towns and villages. It was, by any account, a substantial increase in population and confirms a busier village in every way.
All these people need houses to live in and private dwellings of all types in the village increased by 25.7% between 2016 and 2021 – nearly twice the rate for the previous Census period. There was a smaller increase of 14.8% for the 2479 postcode as a whole.
Whilst state and Byron Shire Council housing policy directions aim to diversify housing stock to account for changing demographics such as an ageing population, more people living alone and the housing needs of young people, Bangalow and 2479 data did not show any significant changes in the types and sizes of private dwellings. Overwhelmingly we are living in separate dwellings (93.4% in the village and 96% in the 2479 postcode), the majority of which remain 3-4 bedrooms in size (82.2% and 78.3% respectively). These figures are well above state and national figures.
 The converse is also evident in the Census data. When it comes to semi-detached, terraces, townhouses, flats or apartments the village sits at 5% compared to NSW at 33.4% and Australia at 26.8%. The 2479 postcode has even less at 2.7%. There was little change in this type of housing between the 2016 and the 2021 Census. We are also underrepresented when it comes to smaller dwellings (0-2 bedrooms) of any type. Our figures of 16.6% and 20.2% were lower than NSW at 30% and Australia at 24.9%. Again there was little change between 2016 and 2021. Note that the ABS does not have a distinct category for secondary dwellings.
Council analyses other data sets to make best estimates of infill development. At the last Census the Herald reported that social housing in Bangalow was pretty much out of the question due to the price of land and property, and that has not changed. We also reported at the last Census that many residents, as they got older, had no choice but to leave Bangalow in order to downsize and/or enter retirement and aged care facilities.
In 2021 26.4% of the population of Bangalow village was 55 years or over, and we are still not providing housing choices for this part of our population. Nor is there any evidence of improvements in affordable housing. The median weekly rent jumped from $515 in 2016 to $680 in 2021, well above both NSW and Australian figures (the Australian median is $375). The proportion of residents in the village who rent did not change much from 2016 to 2021, now sitting at 24.5%.
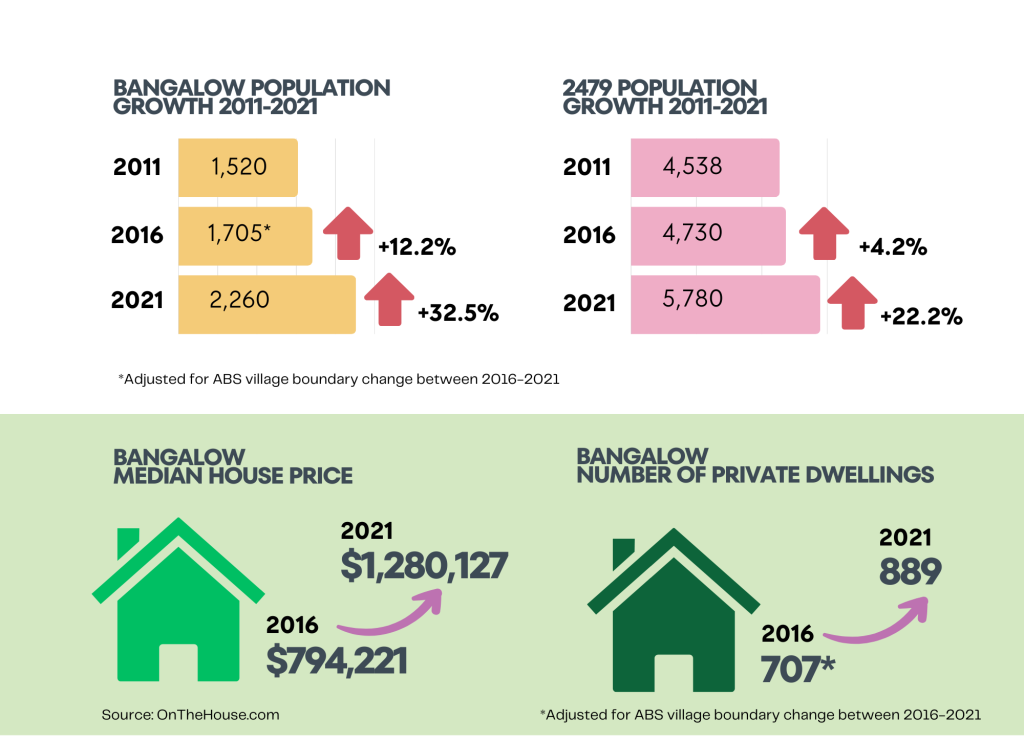 According to onthehouse.com the median house price in 2021 in Bangalow was $1,280,127, a 61.2% increase on 2016, when the figure was $794,221. The median monthly mortgage repayment rose from $1,733 in 2016 to $2,167 in 2021. Given that interest rates were stable and low during 2016-2021, the hike in mortgage repayments can be explained by the rise in house prices across that period.
The median household weekly income in the village jumped from $1,401 in 2016 (only slightly above the NSW and Australian figures) to $2,095 in 2021 (well above both NSW and Australian medians). This is a whopping 49.5% increase that cannot be accounted for by wages growth and suggests changes in the social demographics of our community. The Herald will explore this further in a subsequent article in this series.
These figures point to significant population growth spurt between 2016 and 2021 and changes in the social demographics of our community. The figures do not point to any improvement in affordable housing, social housing or housing options for young and ageing populations in either the village or the 2479 postcode.
Jenny Bird